Graphing Data / Identifying Trends
When the data
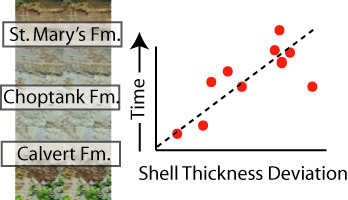
for internal volume and shell thickness versus age was plotted, a trend in
both features was observed over time. A linear trend is defined
as a
statistical
tendency for a pattern to change in one direction, the validity of which
is tested by fitting the line to the trend. Linear
regressions produce a "best fit line" for data values, and the "fit" to
this line is given a value between 0.0 and 1.0. The "fit" of a
linear
regression is identified by the R² notation. An R²
value
of
0.0 indicates no relationship between variables, while a R² value
of 1.0 idicates a one to one relationship between the variables.
It varies as a function of sample size, but R2 values above 0.7 are generally considered statistically robust.
Data collected from Astarte and Anadara shells had
an R² value for both variables of shell thickness and internal
volume that ranged between 0.85 and 0.95. This indicates that a
strong positive relationship exists between these variables and their
age (as measured by stratigraphic position).