Step 2. Selecting Data to Graph
1. "Save" your table. Click on
the "File" menu at the top left and
select "Save." When the dialog box appears, type in a title for your
worksheet, something like "Anadara
Shell Thickness" and click "Save."
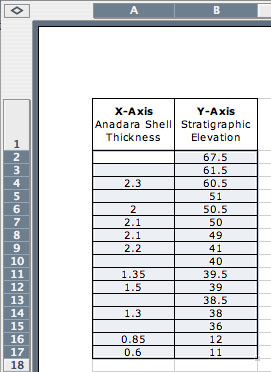
2. Now you are ready to make a
graph! Click and hold the mouse
button on cell 2A. While you
are still holding the button, drag the mouse cursor up and to the left
and highlight all the cells from 2A
to 17B and then let go of the
mouse button. When you have done this correctly, it will look like the
example. (If it doesn't look the
same or you want to try again, click any where on the sheet to
"un-highlight" it and try again.)
3. Be sure to highlight only
the numerical values, not the
words on your worksheet!