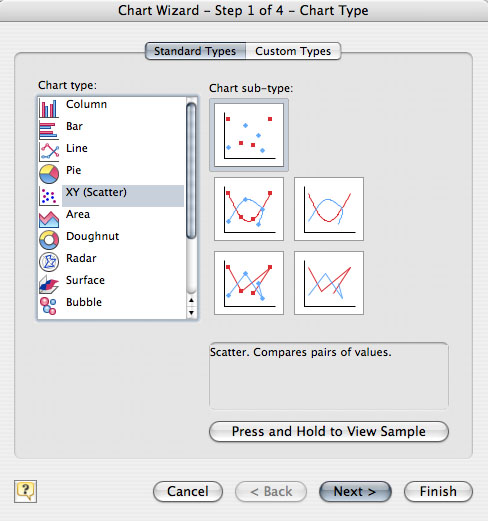
Step 4. Selecting the Type of Graph
1. Select (click on) the "Scatter Plot" option under "Chart
type" on the left side of the dialog box. (It may already be
darkened!).
2. When the Scatter Plot square is selected,
click the "Next" button. The
dialog box below will appear.
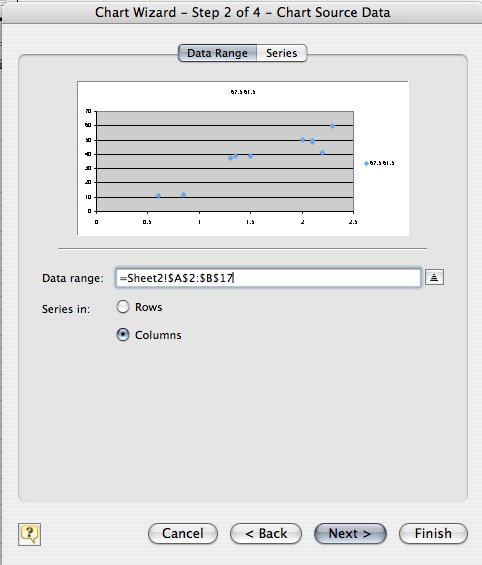
3. This dialog box lets
you select Rows or Columns. Leave it on
"Columns" and click the "Next" button. The dialog box below
will
appear.
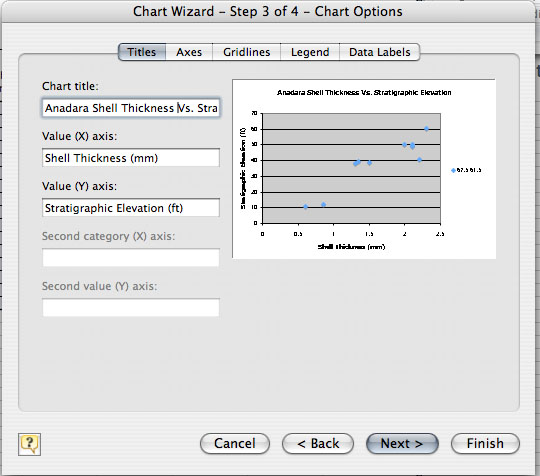
4. This box has many
options. Look for the "Titles" tab at the
top. To the right is a miniature view of what the real graph will look
like. Notice that the chart title has been filled in. Make sure
to type the title YOU want in
this box . Click in the "Category (X)
axis" area, and type the name YOU
want the "bottom" or X axis to read.
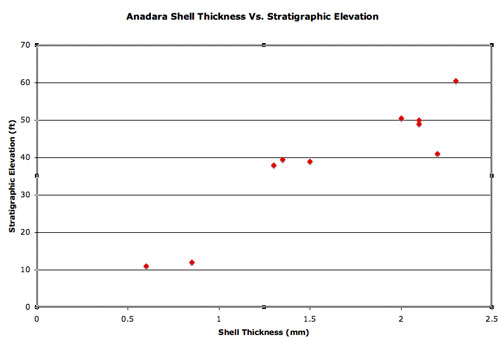
(The sample has "Shell Thickness" as a label.) Do the same for the
"Value (Y) axis:" box. (The
sample has "Stratigraphic Elevation")
After entering your titles click the "Next"
button.
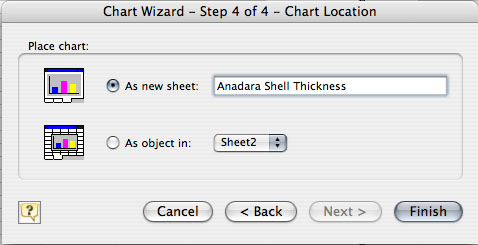
5. With this last dialog
box you can choose where you want the
graph to appear. You can have it show up on the current worksheet or on
a new worksheet. When you have made your choice, click the "Finish"
button and a graph like the one pictured below will appear.