Adding a Trend line
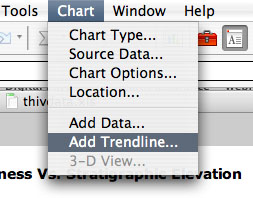
1. Now that you have a
graph the next step is to add a "best fit"
line to your data, in order to determine the relationship between shell
thickness and stratigraphic elevation (time). In order to
"fit" a line to your data you must first select Chart from the menu bar, and scroll
down and select "Add Trend line".
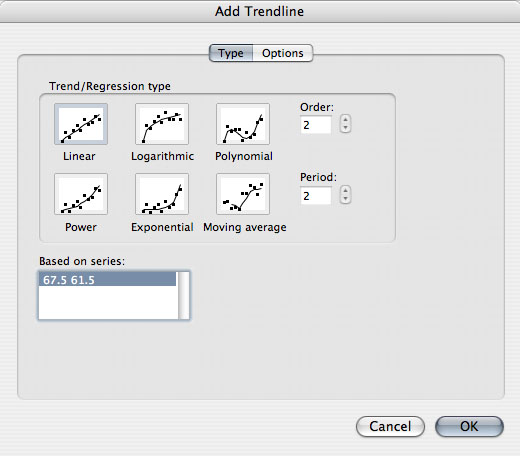
2. Once in the "Add Trundling"
box select the "Linear"
option, because the data on your graph displays a linear
trend. A linear trend is defined as a statistical tendency for a
pattern to
drift in one direction, which is tested by fitting the
line to the linear regression and determining an R value.
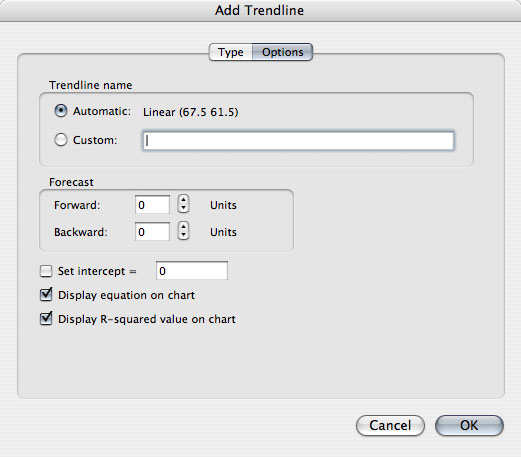
3. Linear regressions
produce a "best fit line" for data values,
and the "fit" to this line is given a value between 0.0 and 1.0.
The "fit" of a linear regression is identified by the R²
notation. An R² value of 0.0 indicates no relationship
between variables, while a R² value of 1.0 indicates a strong
relationship between the variables. To turn on the R² value
for your graph click on the Options tab
in the "Add Trend line" box and
check the boxes entitled "Display
equation on chart", and "Display
R-squared value on chart".
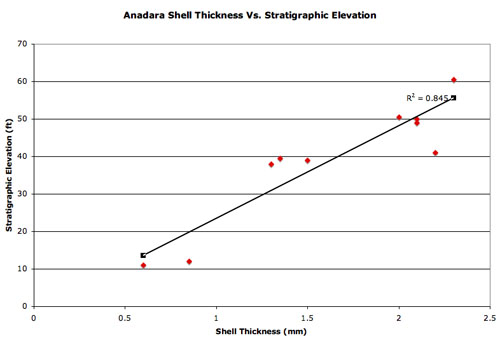
4. Once the boxes have
been check click on the "OK"
button and the chart will appear
with your equation and R² value displayed.